The Capital Case for Not Replacing a Rooftop Unit
Every hour of unnecessary HVAC runtime is billed twice. Only one of those charges shows up.

Most CFOs meet their rooftop units twice.
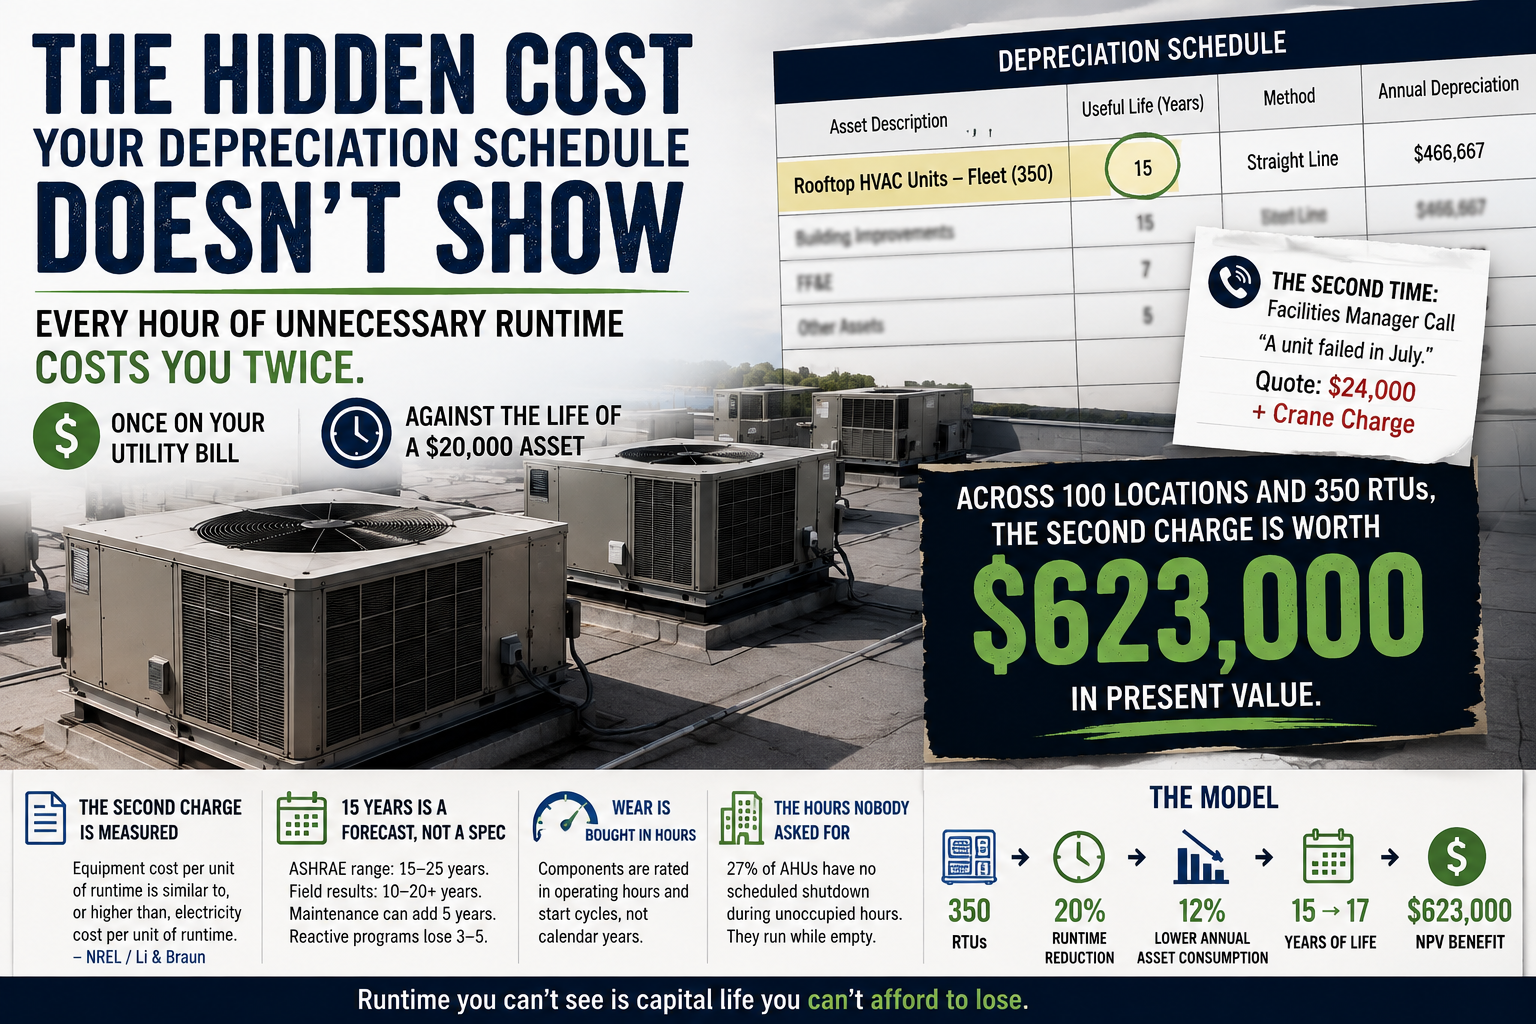
The first time is on a depreciation schedule, where a fleet of packaged HVAC units sits as a single line with a 15-year assumption attached to it. The second time is when a facilities manager calls to say a unit failed in July and the quote came back at $24,000 with a crane charge on top.
Between those two moments, nothing about that asset appears to be under management. The depreciation schedule implies the units are consumed by time. They are not. They are consumed by runtime.
Here is the claim this article defends. Every hour those units run while the building is empty is billed twice. Once by the utility, at a rate you can see. Once against the replacement date of a $20,000 asset, at a rate that has never appeared on a statement anywhere. Across 100 locations and 350 rooftop units, that second charge is worth roughly $620,000.
The second charge is measured
Research funded by the Department of Energy through NREL, building on work by Li and Braun in Energy and Buildings, found that the equipment cost per unit of run time is similar to, or higher than, the electricity cost per unit of run time.
Read that again with a capital budget in front of you.
An unnecessary hour of runtime does not cost you the kilowatt-hours. It costs the kilowatt-hours plus roughly an equal amount of consumed asset life. This is not a vendor claim. It is the standard economic model the national labs use to quantify what HVAC faults cost the country, and it means every schedule left on hold is quietly moving a capital expenditure forward in time.
The 15-year number is a forecast, not a spec
Nobody stamped 15 years on the side of that unit.
ASHRAE puts packaged HVAC equipment in a median range of 15 to 25 years, drawn from survival analysis across hundreds of buildings. In the field the same equipment lands anywhere from 10 to over 20. Disciplined maintenance beats the median by five years. Reactive programs fall three to five short.
The replacement date driving your capital plan is not a property of the fleet. It is an output of how the fleet is operated, and it has a ten-year range.
Wear is bought in hours
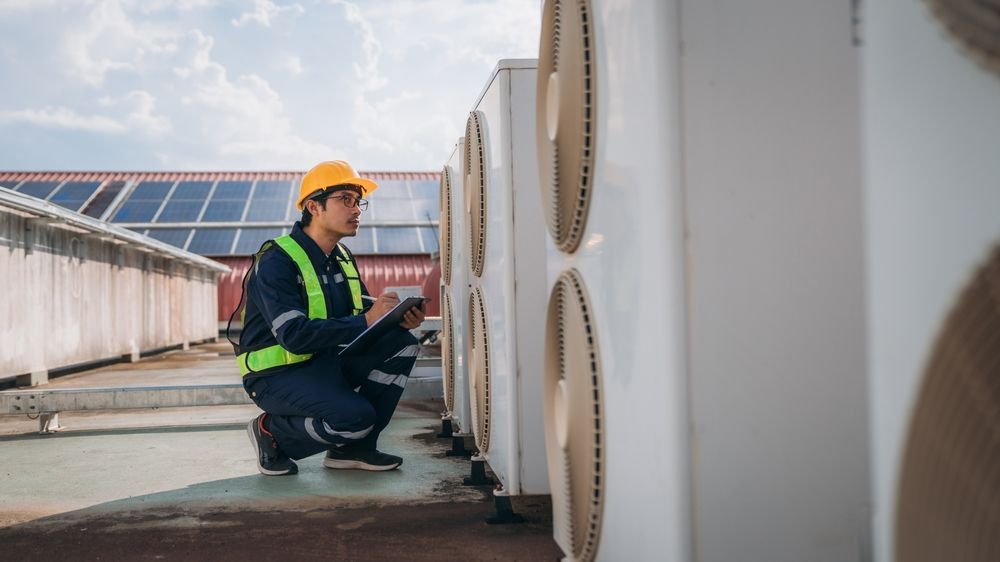
Rooftop components are rated in operating hours and start cycles, not calendar years. Compressors, the most expensive part and the most common terminal failure, accumulate wear per hour of duty.
Geography proves it at scale. Systems in hot climates run 2,500 or more cooling hours a year against 1,000 to 1,500 in moderate ones, and that gap alone cuts three to five years off service life. You cannot change the weather in Phoenix, and nobody should try. But the hours a building runs while it is empty are the same everywhere, and those are the hours in question.
The hours nobody asked for
An analysis of 5,706 air handling units found 27% had no scheduled shutdown at all during scheduled unoccupied hours. More than a quarter ran continuously through periods when the building was, by its own schedule, empty.
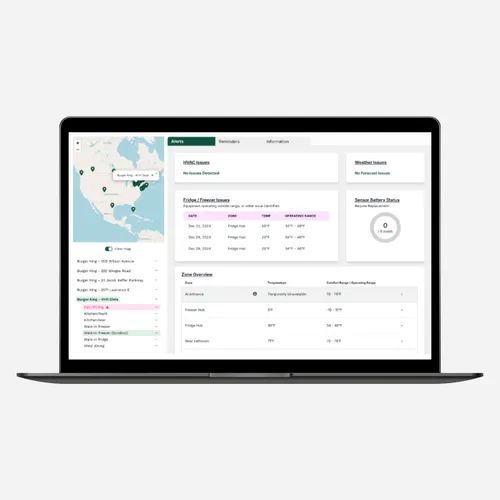
Our own data matches. One multi-site retail client's thermostats were almost universally locked on hold, meaning the equipment ran on a schedule nobody had chosen. After deploying a
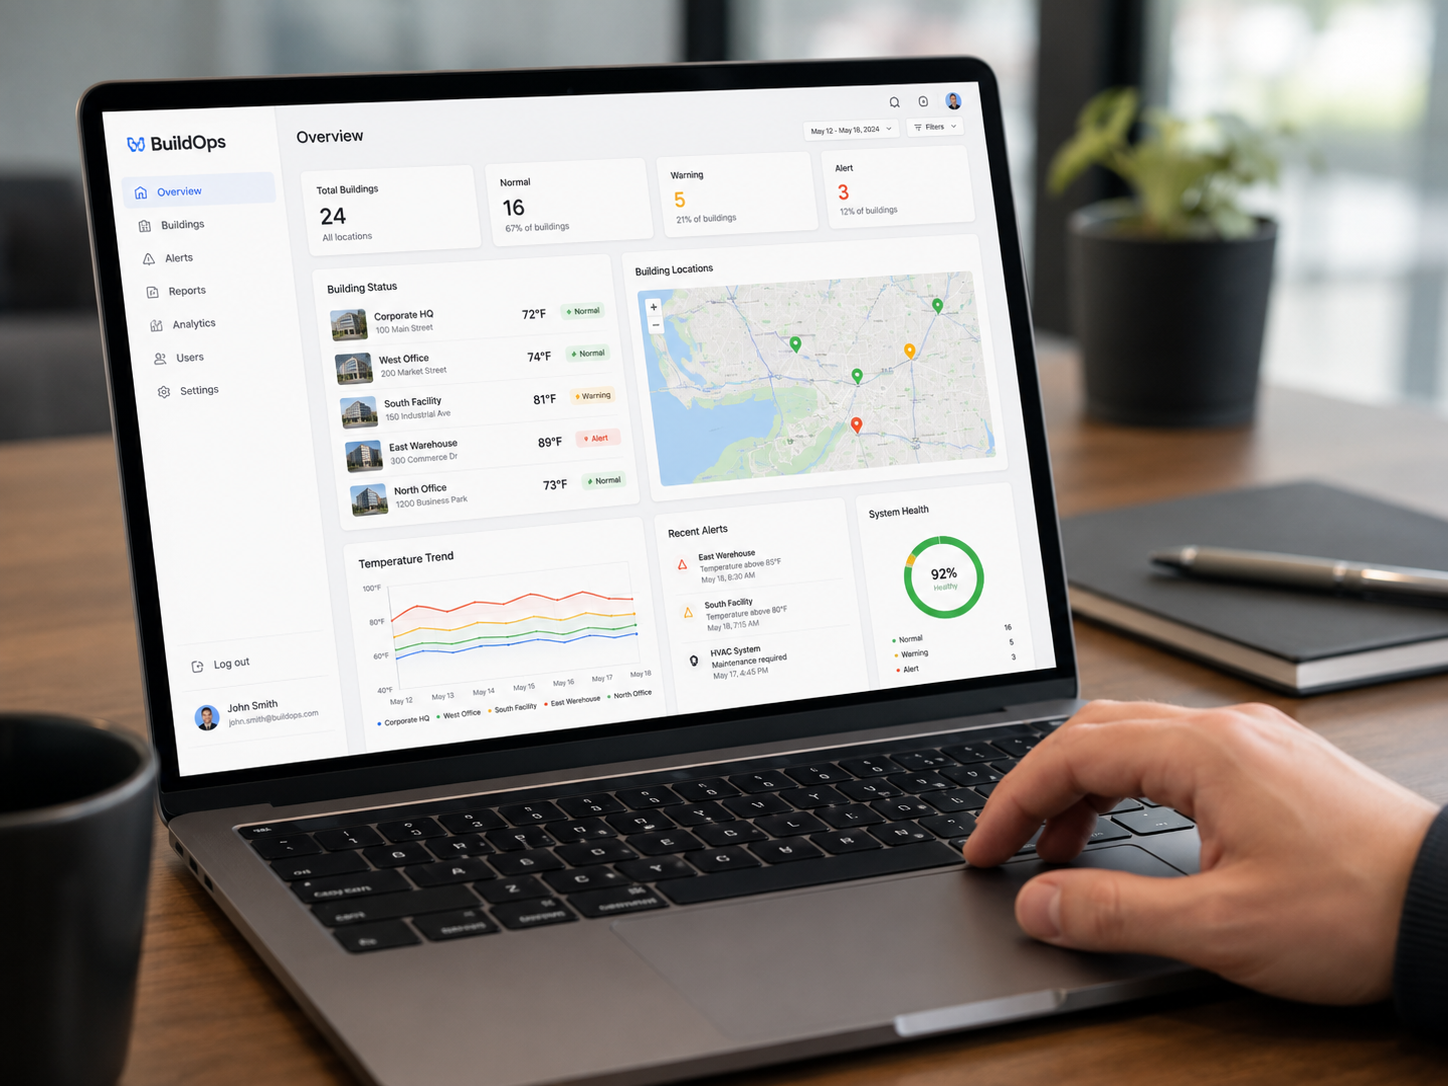
facility thermostat monitoring system, runtime across the portfolio fell 20%, with utility bills down 8 to 11%.
That 20% is booked as an energy result. It is also a capital result, and the capital result is the one nobody has priced.
The model
350 RTUs, 20% runtime reduction, 12% lower annual asset consumption, 15-year life becomes 17 years. $623,000 NPV benefit

| Input | Value |
|---|---|
| Locations / units | 100 / 350 |
| Installed replacement cost per unit | $20,000 |
| Gross replacement value of the fleet | $7,000,000 |
| Baseline service life | 15 years |
| Remaining life / cost of capital | 7 years / 10% |
| Share of wear credited to runtime | 60% |
Deferring a $7 million replacement wave from year 7 to year 9 is worth about $623,000 in present value on the next cycle alone. In steady state it cuts the annualized capital charge on the fleet by 12%, from $467,000 a year to $411,000, in perpetuity.
The 60% attribution is the soft spot:
| Wear credited to runtime | Life added | NPV |
|---|---|---|
| 40% | 1.3 years | ~$418,000 |
| 60% | 2.0 years | ~$623,000 |
| 80% | 2.9 years | ~$857,000 |
Even at the conservative end, the capital effect exceeds most operators' entire annual HVAC repair budget.
What the deferral buys
Extending equipment life does not eliminate capital spending. It relocates it, and relocation is worth more than it sounds.
Every dollar of replacement capex pulled forward is a dollar unavailable for something that compounds. Two years of deferral frees roughly $620,000 in present value, and that capital does not disappear into HVAC. It goes to new locations, an acquisition, a remodel program, or debt paid down at a rate that beats the return on a rooftop unit.
It also buys predictability. Fleets with an unmanaged consumption rate do not fail evenly. They cluster, and clusters arrive as unbudgeted years. Slowing consumption spreads the curve.
And it buys optionality. A unit with two more years of credible life can be replaced during a remodel, when a location is already closed, when equipment pricing is favorable, or when refrigerant regulation makes a different specification obviously correct. Deferral buys the right to time the decision, and timing is where most of the value in capital allocation has always been.
Planned beats emergency
Crane mobilization, curb adapters, and electrical upgrades add $3,000 to $8,000 beyond the base quote. After-hours work on an occupied building adds $2,000 to $12,000. Emergency work carries all of it plus expedited freight and premium labor.
Monitoring moves failures out of the "found out in July" column and into the "budgeted in Q4" column. Converting even 20% of a 350-unit fleet's replacements from emergency to planned, at $5,000 avoided per unit, adds another $350,000 across the cycle.
Four honest limits
Off is not the same as cycling. Thrashing equipment on and off makes things worse. The value is scheduled, monitored off time with cycling limits enforced.
Deferral is not avoidance. You will still replace the units. Anyone claiming a controls platform eliminates $7 million of capital spend is selling you something.
Life is multi-causal. Maintenance, installation, and environmental exposure all matter, which is what the sensitivity table is for.
Energy savings are still the bigger number. Recurring utility reduction outweighs the capital deferral by roughly three to one in present value. That is the argument for running both, since the second adds about 30% to a total finance already approves.
The measurement nobody has
Ask your facilities team how many hours a year each unit actually runs, and how many of those hours fall outside your operating schedule.
Most teams cannot answer, because without an
HVAC remote monitoring system the data has never existed.
Every organization measures depreciation with precision. Almost none measure the variable that determines how fast the underlying assets are consumed. A fleet worth $7 million is being drawn down at a rate nobody tracks, against an assumption nobody has tested, and that rate turns out to be adjustable.
The energy savings justify the project. Capital preservation is what makes it strategic.
Sources
- ASHRAE HVAC Service Life Database; ASHRAE research project TRP-1237 (Abramson et al., 2005). ashrae.org
- Li, H. and Braun, J.E., "An overall performance index for characterizing the economic impact of faults in direct expansion cooling equipment," Energy and Buildings. sciencedirect.com
- National Renewable Energy Laboratory, NREL/TP-5500-70136. nrel.gov
- ASME Journal of Engineering for Sustainable Buildings, unoccupied shutdown control schemes across 5,706 air handling units. osti.gov
- Commercial RTU replacement cost benchmarks, 2026.
oxmaint.com